
Chips fell eight days straight, longest streak since October 2008
by BigWavesAlso available in Chinese · switch language in the footer
The claim. Last week's chip selloff was a grind, not a crash: rare in its persistence, ordinary in its depth. The historical analogs split on what came next, and the split lines up with one variable, whether earnings were falling at the time.
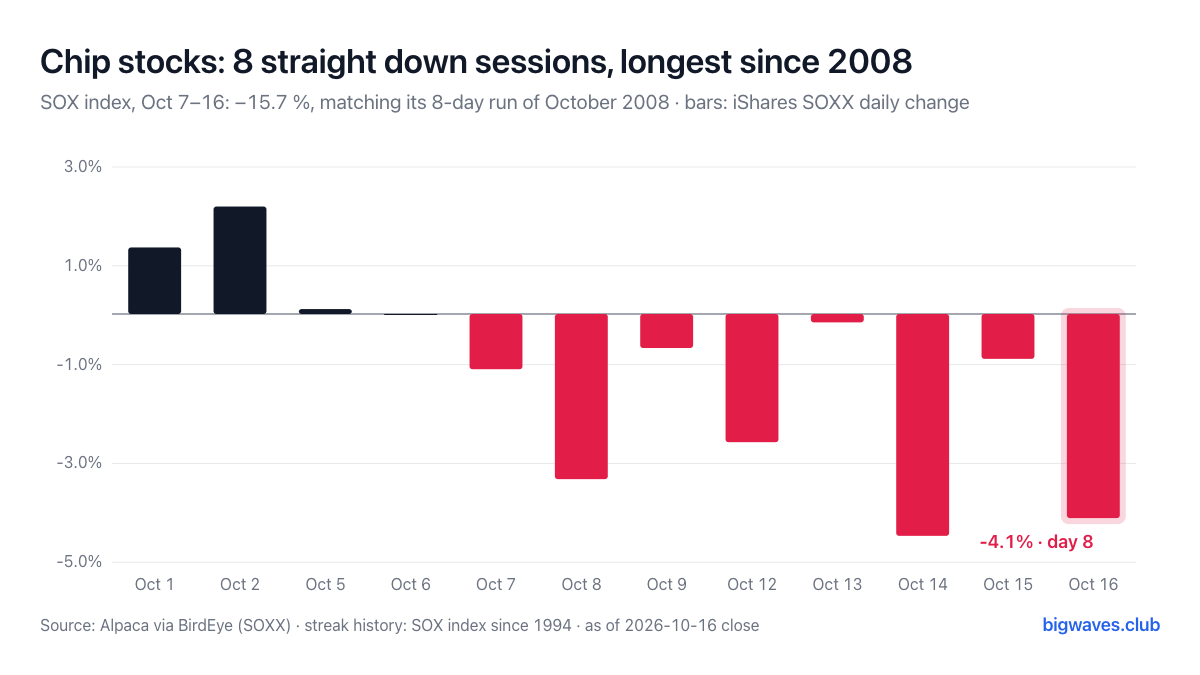 Caption: daily change in the iShares Semiconductor ETF. The red bars are the eight consecutive down sessions of the SOX index, Oct 7 to Oct 16.
Why
- The streak is the rare part. Eight consecutive down closes, Oct 7 to 16. Since 1994 the index has had only seven prior runs of eight or more: July 1996 and May 2006 at nine, and May 2002, September 2002, June 2006, January 2008 and October 2008 at eight. Source: SOX daily closes 1994 to 2026; ETF bars from Alpaca via BirdEye, as of the Oct 16 close.
- The depth is not. A 15.7 percent drop over eight sessions has happened 87 times before, most recently on Apr 8, 2025 at 19.3 percent. The week's 11.4 percent loss ranks 19th worst; the week of Apr 4, 2025 was 16.0 percent.
- It started from a drawdown, not a top. The index closed Friday 24 percent below its June 22 high of 14,635 and is still up 57 percent for the year. This is the third leg down since June.
- The damage was uneven. For the week: SOXX minus 11.8 percent, SMH minus 10.5, Micron minus 14.6, AMD minus 13.0, Nvidia minus 6.6, QQQ minus 5.5, SPY minus 2.0. Memory and second-tier names fell twice as hard as the leader.
- The triggers were macro first. The Oct 14 CPI print lifted rate-hike odds and took the 10-year Treasury to about 5.1 percent. AI capex cost worries and memory-competition comments came second. WTI above 100 dollars sits under all of it.
What we expect
- Base case (1 month): after the 26 prior eight-session drops of 15 percent or more, the index was higher a month later 23 times, with a median gain of 10 percent. If the late-October earnings calls keep 2027 capex guidance intact, a reflex rally of that order is the base case. Signal it is working: a SOX close above the Oct 13 close of 12,209 within ten sessions.
- Alternative (3 months): if a hyperscaler trims capex guidance or memory pricing rolls over, the October 2008 path applies: that streak was followed by another 13 percent decline over the next month and a trough six weeks later. Signal: a close below Friday's low of 11,056 that is not recovered within three sessions.
What would change our mind
- A ninth down session on Monday would make this the longest streak since 1996. After the two nine-day runs, one bounced 12 percent in a month (1996) and the other fell 5 percent (2006). The streak length itself is not the signal; the capex guidance on the calls is.
- Rates. If the 10-year holds above 5.2 percent, the multiple compression continues regardless of chip fundamentals, and the 2022 analog (down again three months later) replaces the 2025 one.
This note is general information and the author's opinion as of the date shown. It is not investment advice and does not consider your situation. The author may hold positions in the securities discussed. Data are from the sources named and may contain errors; past performance does not predict future results. Do your own research.