
NVDA gap-ups after a down day closed green 59% of the time
The claim. An overnight gap-up in NVDA does not tell you much about the session that follows, unless you know what came before it. A gap that reverses a down session has tended to carry through the day. A gap that extends an up session has been a coin flip.
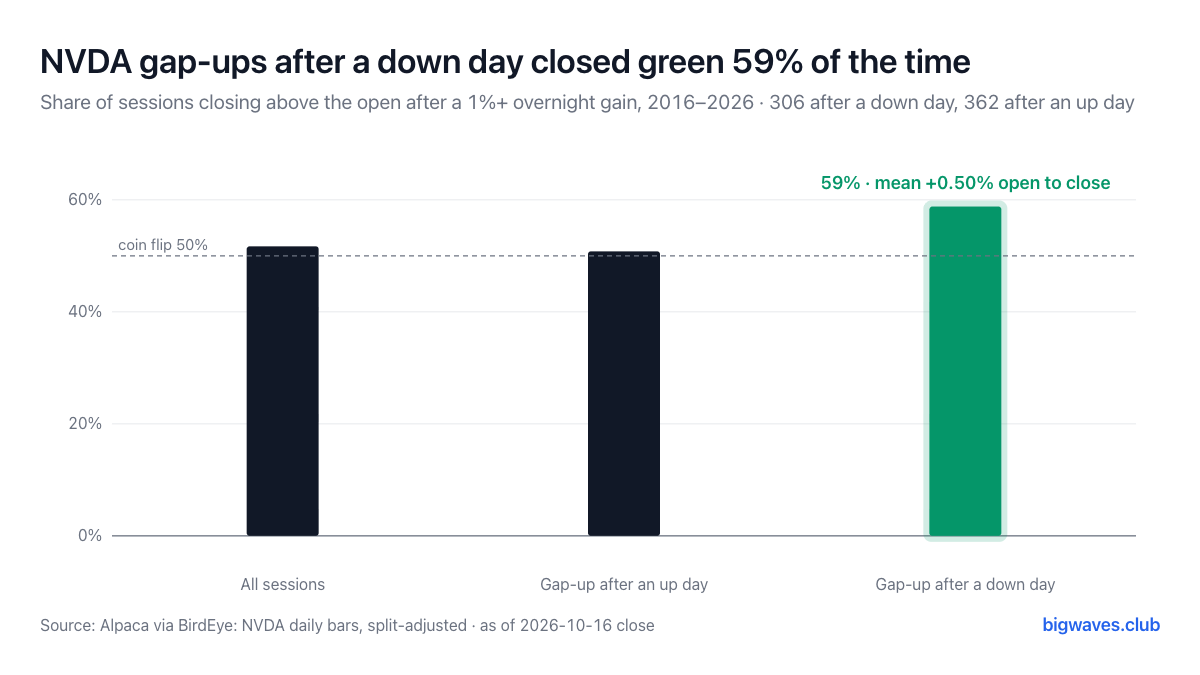 Caption: each bar is the share of cash sessions that closed above the 9:30 open. The green bar is the 306 sessions after a 1%+ overnight gain that followed a down session.
How we measured it
The overnight move is the prior 4:00 pm close to the 9:30 am open, so it includes pre-market and earnings nights. The session is the 9:30 open to the 4:00 pm close. A "down session" is one that closed below its own open. Data: Alpaca daily bars, split-adjusted, Jan 2016 to Oct 16, 2026, 2,711 sessions, of which 668 followed an overnight gain above 1%.
Why
- On its own, the gap barely helps. After 1%+ overnight gains NVDA closed above the open 54.5% of the time, mean +0.16%, median +0.25%. All sessions: 51.7%, mean +0.07%. The difference in means is not significant (t = 1.5).
- The prior session splits it. After a down session: 306 cases, 58.8% closed green, mean +0.50%, median +0.42% (p = 0.002 against a coin flip). After an up session: 362 cases, 50.8%, mean -0.13%. The two groups differ on ranks (p = 0.03).
- It holds in the recent subset. Since 2024, gap-ups after a down session: 100 cases, 56% green, mean +0.56%.
- The gap usually holds. NVDA traded back to the prior close on only 36.8% of gap-up days, against 77% of all days, and closed above the prior close 80.8% of the time.
- The biggest gaps fade a little. Above 5%, mostly earnings nights: 29 cases, median session -1.41%, but the close still kept almost all of the gap.
What we expect
- Base case (to mid-2027, about 30 new events): gap-ups after a down session keep closing green at least 55% of the time. They come about 28 times a year. Signal it is working: 17 or more of the next 30 close above the open.
- Alternative: the split was a product of slicing the data. New events converge on the 51.7% base rate. Signal: 15 or fewer of the next 30 close green.
What would change our mind
- Costs at the open. These are open-to-close returns at the printed open. Real orders at 9:30 pay spread and slippage, which could absorb most of a 0.5% edge on the average day.
- The cut itself. We looked at several splits; this is the strongest of them, not a pre-registered test. The scored calls below are the honest check.
This note is general information and the author's opinion as of the date shown. It is not investment advice and does not consider your situation. The author may hold positions in the securities discussed. Data are from the sources named and may contain errors; past performance does not predict future results. Do your own research.