
After SPY's big sell-side closes, it opened higher 69% of the time
The claim. The market-on-close auction tells you little about tomorrow on an ordinary day. On SPY's biggest closing auctions it tells you one thing: when the close is pushed down, the overnight move tends to bounce. It is a pressure-and-release pattern, not a forecast of direction, and it does not hold for QQQ.
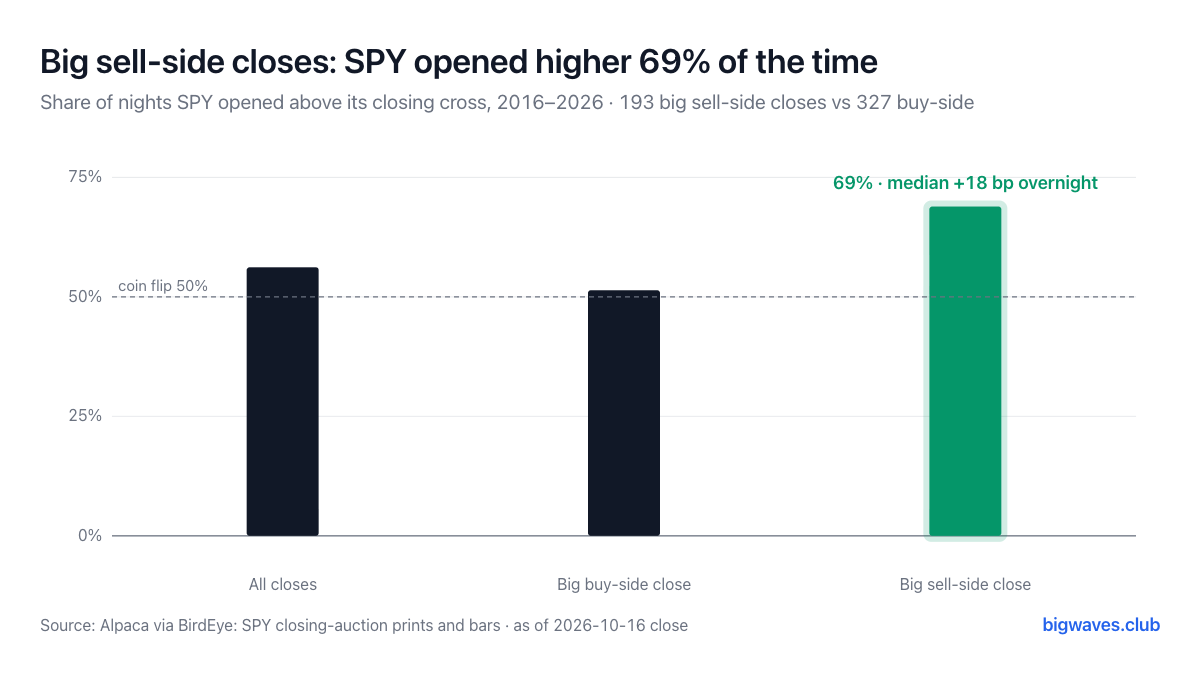 Caption: each bar is the share of nights SPY opened above its closing auction price. The green bar is the 193 big closes where the auction printed below the 3:59 pm price.
How we measured it
No brokerage publishes the 3:50 pm imbalance indications historically, so we used the auction result instead. Alpaca's closing-auction prints give the cross price and size for every day since 2016. "Big" means the auction's share of daily volume is in the top 20% of its year, 545 of 2,702 days. "Sell-side" means the cross printed below the 3:59 pm price, 193 of those days; "buy-side" means above it, 327 days. The target is the next open against the cross. Source: Alpaca SIP via BirdEye, 2016-01-04 to 2026-10-16.
Why
- On ordinary days there is nothing. Across all 2,702 days the auction move and the overnight move have a rank correlation of -0.03 (p = 0.12). By auction-move quintile the average overnight move goes -0.4, +6.9, +2.7, +5.1, +1.9 bp: no pattern.
- On big days the split is large. After big sell-side closes SPY opened higher 68.9% of the time, median +17.6 bp. After big buy-side closes, 51.4%, median +1.3 bp. All days: 56.2%, median +6.2 bp. The difference is significant on ranks (Mann-Whitney p = 0.0003; up-rate z = 3.9).
- It survives the obvious control. A sell-side close often comes on a down day, and down days bounce anyway. Holding the day's own move constant, the rank effect remains (t = -2.1). It is strongest on up and flat days: on up days with a big sell-side close, SPY opened higher 83% of the time (41 cases), against 49% after a buy-side close.
- The averages are not the story. A linear fit on big days gives t = -5.9, but removing the 1% most extreme nights cuts it to -1.3. Six nights such as Mar 31, 2020, Nov 9, 2022 and Apr 9, 2025 each moved 2 to 4 percent. Use the hit rate, not the average.
- QQQ shows none of it. Up rate 53.0% after big sell-side closes, 56.8% after buy-side, p = 0.74. QQQ's auction is a median 0.95% of daily volume, half of SPY's 1.84%.
What we expect
- Base case (to mid-2027, about 12 more events): the pattern holds out of sample, with SPY opening higher after at least 60% of new big sell-side closes. Big sell-side closes come about 18 times a year. Signal it is working: 8 or more of the next 12 open higher.
- Alternative: it was a sample artefact. The up rate on new events falls to about the 56% base rate of all nights. Signal: 6 or fewer of the next 12 open higher.
What would change our mind
- The real imbalance data. The auction price only shows the side that won. A large imbalance fully absorbed by offsetting orders leaves no trace in our proxy. The exchange imbalance feed for NYSE Arca, available from data vendors, would test the claim directly; if the imbalance quantity itself shows no relation to the next open, the pattern is about price pressure only.
- A regime change in closing volume. Closing auctions have been taking a growing share of daily volume. If that share keeps rising, the pressure-and-release effect could fade as more liquidity meets at the close.
This note is general information and the author's opinion as of the date shown. It is not investment advice and does not consider your situation. The author may hold positions in the securities discussed. Data are from the sources named and may contain errors; past performance does not predict future results. Do your own research.