
TSLA explains 6% of SPCX's daily moves, and none net of the Nasdaq
by BigWavesAlso available in Chinese · switch language in the footer
The claim. There is no measurable "Musk factor" linking Tesla and SpaceX stock. Both are high-beta Nasdaq names, and that shared market exposure is the whole of their correlation. Using one to trade or hedge the other is a bet on the Nasdaq, not on Musk.
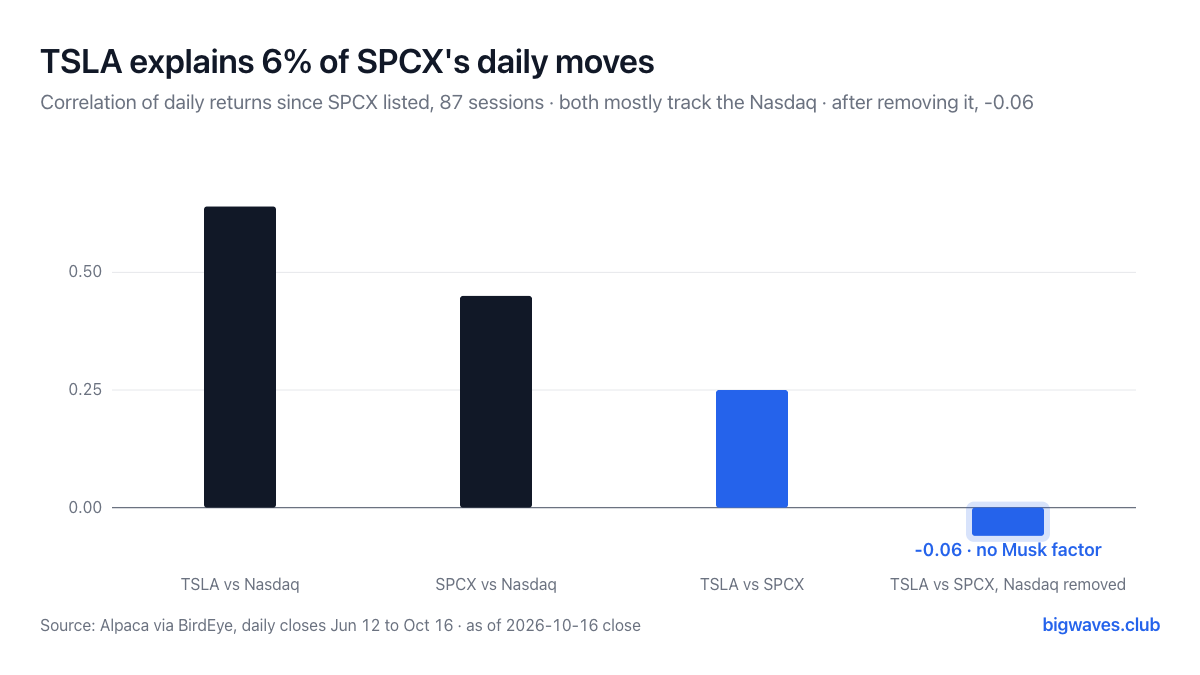 Caption: the two blue bars are the TSLA-SPCX link. The left one is what you see in raw returns; the right one is what is left once the Nasdaq's move is taken out.
Why
- The raw link is weak. Daily returns of TSLA and SPCX correlate 0.25 over the 87 sessions from SPCX's first close on Jun 12 to Oct 16. Squared, Tesla explains about 6% of SPCX's daily variance. Weekly returns correlate 0.49. Source: Alpaca daily closes via BirdEye, as of the Oct 16 close.
- Each tracks the Nasdaq more than the other. TSLA correlates 0.64 with QQQ, SPCX 0.45. Their betas to QQQ are 1.52 and 1.73. Two stocks that each move one and a half times the index will look related without being related.
- Net of the Nasdaq, nothing is left. Strip each stock's QQQ-beta move from its daily return and the residuals correlate -0.06. On the 12 days Tesla moved more than 4%, SPCX went the same way 7 times, close to a coin flip.
- The price chart misleads. Price levels correlate 0.71, because both drifted down together: TSLA is down 12.7% since Jun 12, SPCX 9.3%, QQQ 1.6%. Shared trends inflate level correlations; returns are the honest measure.
- The recent tightening is the selloff. The 20-day rolling correlation went from -0.11 on Jul 29 to 0.08 at the end of July, 0.18 in August, 0.55 in September and 0.62 on Oct 16, close to its high of 0.63. That climb coincides with the tech selloff, when high-beta names fall together.
What we expect
- Base case (8 weeks): when the Nasdaq stabilises, the TSLA-SPCX 20-day correlation falls back below 0.30, its July-August range. Signal it is working: QQQ closes a week above its Oct 9 level and the 20-day correlation prints under 0.30 by mid-December.
- Alternative: the correlation stays above 0.50 even as the market calms. That would mean a genuine shared factor has emerged: a cross-holding, financing, or a Musk event that hits both. Signal: three or more sessions where both move over 3% in the same direction while QQQ moves less than 1%.
What would change our mind
- The market-adjusted correlation rising above 0.30 over a rolling 40 sessions. That is the number that measures a Musk factor directly; at -0.06 today, it has a long way to go.
- SPCX supply events. If SPCX's lock-up follows the standard 180 days, it ends around Dec 9. A supply shock in one stock only would push the two further apart, not together.
This note is general information and the author's opinion as of the date shown. It is not investment advice and does not consider your situation. The author may hold positions in the securities discussed. Data are from the sources named and may contain errors; past performance does not predict future results. Do your own research.